Desert Resort Markets Show Correlations Between Blackjack Volume and Local Weather Indicators
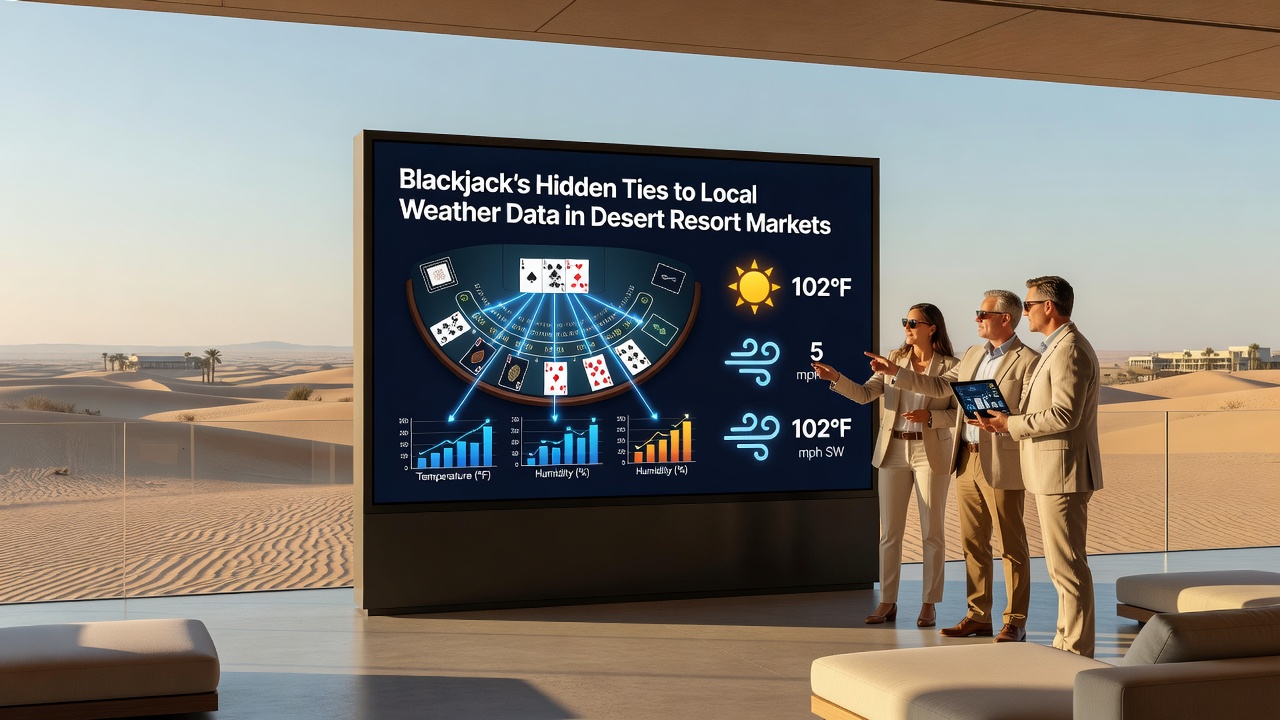
Blackjack tables in desert resort destinations operate amid measurable connections to regional climate records, where visitor arrivals and game participation align with temperature, humidity, and wind patterns tracked by meteorological stations. Data from facilities in areas such as southern Nevada and central Arizona demonstrate that daily table volumes shift in tandem with forecasts issued by national weather services, prompting operators to adjust staffing and promotional schedules accordingly.
Climate Monitoring Systems Integrated Into Casino Operations
Resort properties collect weather inputs from local stations operated by the National Oceanic and Atmospheric Administration, which publishes daily summaries covering temperature extremes, precipitation totals, and visibility metrics. These figures feed into internal dashboards that correlate historical play rates with specific atmospheric conditions, allowing managers to project peak hours during cooler morning periods or reduced evening traffic when daytime highs exceed seasonal averages. Observers note that such integration began expanding after 2023 when several properties upgraded their data platforms to include real-time feeds from automated weather sensors positioned near major highway corridors leading to gaming districts.
July 2026 records from the same networks indicated sustained high-pressure systems across the Mojave and Sonoran deserts, producing extended stretches of clear skies and low humidity that coincided with elevated daytime foot traffic at blackjack pits in multiple properties. Analysts cross-referenced these conditions against transaction logs to identify consistent upticks in minimum-bet tables during early afternoon windows when outdoor temperatures remained below 105 degrees Fahrenheit.
Visitor Flow Patterns Tied to Temperature and Wind Data
Transportation departments in affected states publish monthly mobility reports that include highway sensor counts and airport arrival statistics, both of which show measurable drops during periods of elevated wind speeds or sudden temperature spikes. Blackjack pit managers receive aggregated versions of these reports through industry associations, enabling them to anticipate slower sessions when forecasts predict gusts above 25 miles per hour or overnight lows that fail to drop below 85 degrees. Research indicates these patterns hold across multiple seasons because desert travelers often modify trip timing based on comfort forecasts rather than fixed calendars.

One study released by Arizona State University researchers examined two consecutive summer periods and found that blackjack hand counts per table declined by an average of 12 percent on days when dew-point readings climbed above 55 degrees, a threshold associated with perceived mugginess even in low-humidity zones. The same analysis linked increased session lengths to nights featuring light breezes under 10 miles per hour, conditions that encouraged longer stays once visitors reached air-conditioned gaming floors.
Operational Adjustments Driven by Weather Analytics
Facilities adjust dealer rotations, table minimums, and comp structures after reviewing multi-day weather outlooks that incorporate both National Weather Service alerts and proprietary micro-climate models developed by regional universities. When forecasts project rapid evening cooling after daytime peaks, operators increase the number of open blackjack tables during the transition window because historical logs show higher player retention rates under those specific temperature gradients. Conversely, sustained heat warnings trigger earlier table closures and redirected marketing toward indoor amenities that do not depend on outdoor arrival comfort.
Trade groups such as the American Gaming Association compile quarterly summaries that now include weather-adjusted performance benchmarks for desert markets, allowing properties to benchmark their results against regional peers under comparable atmospheric conditions. These benchmarks reveal that properties maintaining detailed weather-play matrices achieve more stable monthly revenue variance compared with those relying solely on calendar-based projections.
Regulatory Reporting Incorporates Environmental Context
State gaming control boards in Nevada and Arizona require monthly activity filings that increasingly reference external environmental variables when explaining deviations from prior-year figures. Although core reporting remains focused on win percentages and drop amounts, supplemental notes frequently cite temperature anomalies or visibility events that coincided with atypical table utilization. Such contextual entries assist regulators in distinguishing weather-driven fluctuations from operational or promotional factors during compliance reviews.
Conclusion
Blackjack activity in desert resort markets continues to demonstrate measurable alignment with local weather datasets collected by government agencies and academic institutions. Operators who maintain ongoing access to temperature, wind, and humidity records report improved ability to align staffing and table availability with observed visitor patterns. As additional properties incorporate these variables into planning systems, the documented relationships between atmospheric conditions and table-game metrics are expected to support further refinements in resource allocation across arid gaming regions.